Periodic water / gas / utility consumption graphs
by Benjamin Schieder
I’ve been searching for this for a long time, scouring the homeassistant forums, implementing workarounds, but nothing was really satisfying. Until I found https://www.home-assistant.io/dashboards/statistics-graph/ for HomeAssistant.
This has finally enabled me to implement proper daily / weekly / monthly consumption graphs for my water and gas meters. It’s a dashboard card, so it doesn’t go into configuration.yaml and has a GUI edit option as well.
Example configuration in YAML:
chart_type: bar
period: month
type: statistics-graph
entities:
  - entity: sensor.wasserzaehler_m3
    name: Wasserverbrauch (Monat)
stat_types:
  - change
days_to_show: 365
logarithmic_scale: false
This will create a bar chart of monthly water consumption for the last year:
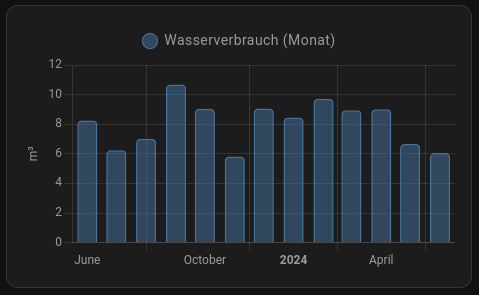
The important thing here is that I want the usage per month, so I need the stat_type change and the period month. This will chart the difference from the start of the period to the end of the period, which translates to “water consumed per month”.
Hope this helps anybody trying to do this. The HomeAssistant forums are full of this question with no answers.
EOF
Subscribe via RSS
Comments
You can use a Mastodon account to comment on this article by replying to the associated Mastodon toot.